A comparison test was conducted on the fatigue cracked specimens of self-made aluminum alloy treated by sand-blowing and grinding to analyze the effect of different surface conditions on the fluorescence penetration detection of aluminum alloy castings. The results show that the sand-blown treatment is more likely to cause crack defect blockage and affect the detection of defects, while the polished treatment is less likely to cause obvious blockage of defect openings.
Aluminum alloy has low density, good corrosion resistance, high fatigue resistance, and high specific strength and stiffness, making it an ideal material for aircraft structures. At present, aluminum alloys account for 60% to 80% of the use in aircraft. In recent years, the application of aluminum alloys in aircraft has been challenged by ferrous alloys and composite materials.
However, due to the abundant aluminum resources, aluminum alloys have excellent performance, easy processing and low cost; in addition, with the emergence of new heat treatment processes and the continuous application of new aluminum alloys such as aluminum button alloys in aircraft, the application of aluminum alloys in aircraft structures still has irreplaceable advantages.
Before fluorescent penetrant inspection of aluminum alloy castings, they are generally treated by sandblasting to remove surface adhesions such as oxide, paint, etc., that affect fluorescent penetrant testing, so that the surface of the parts can form a more uniform fluorescent background display. Usually, the defects found in the fluorescent penetrant inspection of aluminum alloy billet castings can be removed by grinding within the remaining amount, and the non-critical parts after grinding can be repaired by welding.
However, the effect of sand blowing and grinding treatment on the detection sensitivity of metallurgical defects in aluminum alloy castings by fluorescent penetrant inspection has been a matter of great concern.
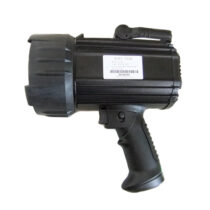
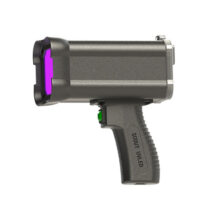
SCOUT UVLED have conducted sand-blowing and grinding of self-made aluminum alloy fatigue crack specimens and compared the results of fluorescent penetrant inspection, supplemented by scanning electron microscopy microscopic examination of the changes in defects. The results can provide effective data support for the arrangement and quality control of the penetrant inspection process of aluminum alloy castings, and can provide reference for the development of fluorescent penetrant inspection standards.
The ZL205A cast aluminum alloy material was used for the test, which was cast into a flat specimen and then machined into a fatigue specimen as shown in Figure 1. Fatigue cracks were produced on both sides of the hole shown in Figure 1, and a total of two fatigue crack specimens, numbered 202 and 224, were produced.
The two specimens were subjected to fluorescent penetrant inspection with the following parameters: water-washed fluorescence infiltration solution, secondary sensitivity; infiltration time of 30 min, drying time of 15 min, dry powder development, development time of 30 mine At the same time, the specimens were examined microscopically by scanning electron microscopy, and photographs of defects were recorded.

Fig. 1 Appearance of fatigue cracked specimen
At the same time, blown sand and fluorescence penetration test were performed on specimen #224, and the test results and microscopic photos were recorded; then the defects were sanded again, and the changes of fluorescence display and microscopic photo data were also recorded; finally, all test data were summarized and compared for analysis.
2.1.1 Fluorescent penetrant inspection results
The results of the fluorescent penetrant inspection of the machined surfaces of specimens #202 , #224 are shown in Figure 2. Two crack fluorescence displays were found on each of the two specimens, and the fluorescence display of the cracks showed a continuous linear display.

Fig. 2 Fluorescence penetration test results of machined surfaces of specimens #202, #224
2.1.2 Scanning electron microscopy microscopic inspection results
The results of the microscopic observation of the cracks of specimens 202 and 224 are shown in Fig. 3. As shown in Fig. 3, the cracks were intermittently distributed; for specimen 202, the maximum width of the crack was about 15 µm and the minimum width was about 1 µm; for specimen 224, the maximum width of the crack was about 5 µm and the minimum width was about 1 µm.

Fig. 3 Microscopic photographs of cracks in specimens #202, #224
2.2.1 Fluorescence penetrant test results
The crack fluorescence display on specimen No. 202 was polished (polishing depth of 0.5 mm) and then observed under black light, and the results are shown in Fig. 4(a). As can be seen from the figure, the crack fluorescence display did not change significantly, but the permeate reperfusion was weakened and the width of the linear display was reduced.

Fig. 4 Comparison of results after grinding of specimen #202
2.2.2 Scanning electron microscopy microscopic inspection results
Scanning electron microscope microscopic examination was performed on the defective area of the specimen, and the microscopic morphology is shown in Figure 4(b). As can be seen from the figure, the crack opening was still exposed to the surface after grinding, and no obvious opening blockage was found, except for the local aluminum burrs and metal chips at the crack opening.
2.3.1 Fluorescent penetrant inspection results after sand-blown treatment
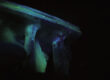
The fluorescent penetrant inspection was performed on #224 specimens after sand-blown treatment, and the results are shown in Fig. 5(a). As can be seen from the figure, the crack display becomes intermittent linear display, and most of the whole crack does not appear fluorescence display, while the other crack does not appear fluorescence display.

Fig.5 Comparison of results at defects after sand blowing of specimen #224
2.3.2 Scanning electron microscopic inspection results after sand-blowing treatment
Scanning electron microscopy The microscopic morphology was observed as shown in Fig. 5(b). As seen from the figure, most of the cracks are masked.
2.3.3 Observations under SCOUT UVLED black light after sand-blowing treatment and then sanding treatment
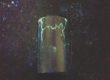
The results are shown in Fig. 6(a) after grinding the cracked area of specimen #224 and then observed under SCOUT UVLED black light. As can be seen from the figure, the cracked area of specimen #224 showed fluorescence after polishing, but the brightness of fluorescence display was low and the repermeation of permeate was not obvious.

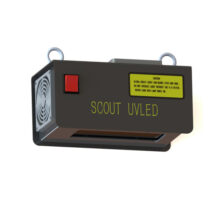
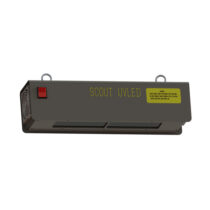
UV-A LED Light for FPI
2.3.4 Scanning electron microscopic inspection results of sand-blown treatment followed by sanding treatment
The microscopic morphology at the defect was observed by scanning electron microscopy, as shown in Fig. 6(b). As can be seen from the figure, the cracks blocked by sand-blowing in front were re-exposed to the surface after sanding.

Fig. 6 Comparison of results after sandblasting and sanding of specimen #224
2.3.5 Fluorescent penetrant inspection results after ultrasonic cleaning
Ultrasonic cleaning was performed on the polished area of specimen #224, and then fluorescence penetration testing was performed, and the results are shown in Figure 7. As can be seen from the figure, the crack fluorescence display at the defect of specimen 224 is significantly brighter than the fluorescence display shown in Figure 6(a), and the reperfusion image is also more obvious. This indicates that the defects after grinding shown in Figure 6(a), although exposed to the surface, but due to the serious blockage caused by the previous sand-blowing treatment, so that the penetration into the defects significantly reduced; even after grinding the defect openings exposed, but the amount of penetration re-infiltration is still less, which in turn caused the fluorescence display brightness is lower and re-infiltration is not obvious.
From Figure 2, it can be seen that the fluorescence display of the fatigue crack defect is linear, and the defect can be easily determined as a crack display according to the fluorescence display. From the SEM microscopic morphology of the fatigue crack shown in Fig. 3, it can be seen that the crack is not completely open on the surface, but intermittently distributed; its fluorescence display is continuous linear display, which can be seen that the amplification effect of the fluorescence display on the defect makes this microscopic discontinuity completely masked, and then form the fluorescence display, i.e., the macroscopic display.
As shown in Fig. 4(a), the fluorescence display of the cracked defect area is still clear after grinding and polishing, but the amount of permeate re-infiltration is significantly reduced, and the width of the crack fluorescence display becomes smaller and finer. The reason for the decrease in the width of the fluorescence display is that the depth of the crack is smaller, resulting in less permeate retained inside the defect, which leads to less repermeation.
As can be seen from Fig. 5, the surface of the specimen is easily blocked after sandblasting, which can easily cause the fluorescence display of the defect to become weaker or miss detection. After sanding, the defects blocked by sandblasting are easily exposed to the surface, but after sanding, the defects are exposed to the surface, but the infiltration of permeate into the defects is greatly reduced due to the severe blockage caused by sandblasting; even though the defects are exposed after sanding, the amount of permeate re-infiltration is still low, which results in low fluorescence display and inconspicuous re-infiltration, or even completely missed detection. Therefore, it is necessary to examine the area after polishing. Therefore, the polished area needs to be reprocessed (e.g., ultrasonic cleaning) and then re-tested for fluorescence penetration testing, so that the permeate can fully penetrate into the defects to improve the quality of testing.
- Sand-blowing treatment is very likely to cause the blockage of the open defects on the surface of aluminum alloy castings, which in turn causes the leakage of fluorescence penetration detection.
- The fluorescence of defects on aluminum alloy castings should be reprocessed after grinding (e.g. ultrasonic cleaning), and then rechecked for fluorescence penetration testing.
- The fluorescence of fatigue cracks on aluminum alloy parts shows a linear distribution, but the SEM microscopic morphology is intermittently distributed.
- Fluorescent penetrant inspection method can detect surface open crack defects with a width of 1 µm or more.